| View previous topic :: View next topic |
| Author |
Message |
bmmiller
Joined: 23 May 2007
Posts: 110
|
 Posted: Thu Feb 25, 2016 6:09 pm Post subject: California Meteorologist Forecasts Return Posted: Thu Feb 25, 2016 6:09 pm Post subject: California Meteorologist Forecasts Return |
 |
|
To all of you who rely on, refer to, or simply enjoy for entertainment value our meteorologist forecasts:
Our attended meteorologist forecast will return for California on March 1st! We'll start out with one forecast each morning and before long we'll be back to full speed with updates at 7AM, 11:30AM, and 7PM!
-Benjamin
|
|
| Back to top |
|
 |
gerritt
Joined: 06 May 1998
Posts: 632
Location: Redwood City, CA
|
| Posted: Thu Feb 25, 2016 6:27 pm Post subject: |
|
|
| Nice!
|
|
| Back to top |
|
|
bert
Joined: 10 Apr 2000
Posts: 665
|
| Posted: Thu Feb 25, 2016 7:10 pm Post subject: |
|
|
Thanks
Windsurf season for me officially begins on the Ides of March until mid October so I'm chomping at the bit to get back to the routine. Still stoked about our sport after 30+ years.
|
|
| Back to top |
|
|
windoggi

Joined: 22 Feb 2002
Posts: 2743
|
| Posted: Thu Feb 25, 2016 7:13 pm Post subject: |
|
|
March winds gonna blow all my troubles away.....
_________________
/w\ |
|
| Back to top |
|
|
stevegoebel
Joined: 20 Nov 2006
Posts: 6
|
| Posted: Thu Feb 25, 2016 8:16 pm Post subject: |
|
|
Now we canbe mad at you again when its not windy 
|
|
| Back to top |
|
|
scameron
Joined: 18 Apr 1996
Posts: 25
|
| Posted: Fri Feb 26, 2016 11:26 am Post subject: |
|
|
| Great news! Life is now worth living!
|
|
| Back to top |
|
|
loopless
Joined: 30 Jun 1997
Posts: 426
|
| Posted: Fri Feb 26, 2016 1:49 pm Post subject: |
|
|
| iWindSurf needs to update their predictive models to provide more resolution. Its kind of sad to go to a surfing site, but Surfline's "hi-res" wind forecasts are proving much more detailed and accurate in predicting and capturing local variations, at least in San Diego which is notoriously fluky. I use them almost exclusively now.
|
|
| Back to top |
|
|
windfind
Joined: 18 Mar 1997
Posts: 1902
|
| Posted: Fri Feb 26, 2016 3:38 pm Post subject: |
|
|
Hi Loopless,
I suspect you are using the old Classic iwindsurf. If so explore the new iwindsurf
http://windalert.com/en-us/Search/ViewResults.aspx#32.712,-117.136,11,309585
and compare it with the Surfline (the BEST on the web when it comes to surf) you will find that the highest resolution model they currently use for the San Diego area is the great NAM 5 kilometer model.
While iwindsurf presents you with:
1. The same NAM 5 km model data PLUS:
2. The WRAMS 4 km model data
3. The HRRR 3 km model data
4. WRF 3km model data
5. The WRAMS 8 km model data
and as you can see in the bottom image a host of other models. PLUS you can see all of them at the same time to get the consensus!
Remember that there only about a dozen models almost all of which run on supercomputers owned by universities and the government. All weather companies like weatherflow and our competitors do is take that raw data and present it in different formats like tables, virtual buoys, graphs, static maps or zoomable maps. But for each model it is just the same data in a different format.
Since each model breaks a region into quadrants like 4 km etc. you are wise to use a map presentation of the model data NOT tables etc. Why? Because your launch site may be on the very edge of a quadrant and the water where you sail may be in a different quadrant giving you a useless forecast. With a map you can see this clearly.
So bottomline when you are looking at the NAM 5 it does not matter which company's presentation you are looking at... it is the same data. But our creaky old Classic iwindsurf will not present you with latest and greatest in models.
Also the best forecast will usually come from the model with the highest resolution. And for that you can not beat the WRAMS 4 km and the HRRR 3 km we present.
But none of the models do a very good job with the very local San Diego thermal winds in the summer.
Below you can see our zoomable San Diego map of the WRAM 4km. And with a click of the mouse you can see the same map with the HRRR or NAM 5km etc.
Hope this helps. I will try to do a blog on models and different presentation this summer.
Mike Godsey
iwindsurf.com/ikitesurf.com
Weatheflow.com
| Description: |
|
| Filesize: |
391.26 KB |
| Viewed: |
16997 Time(s) |

|
|
|
| Back to top |
|
|
loopless
Joined: 30 Jun 1997
Posts: 426
|
| Posted: Sat Feb 27, 2016 12:10 pm Post subject: |
|
|
Hi Mike,
Thanks for your detailed reply.
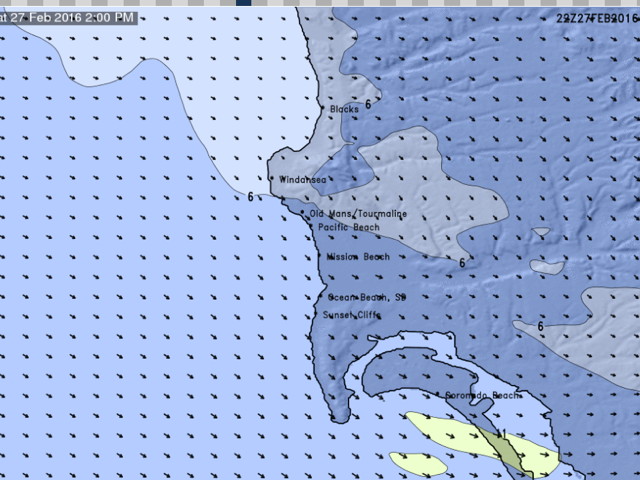
Attached are two images for the same time today. One from Surfline, one from windalert. They seem quite different to me The Surfline one shows winds from the NW that might indicate a possible good light wind day. The windalert image shows light W wind - that would mean "no chance".
My other comments are
- Cheap computing power has increased enormously in the last few years. Why are we not running higher resolution models?
- Why do not the models use feedback from the iWindSurf sensor network to provide better predictions? On pre/post santa ana conditions, we often get really good days. These are NEVER predicted by iWindSurf, yet you have the sensor data that must be in direct conflict with the models. Why can't the numerical models take some positive feedback from real conditions?
| Description: |
|
| Filesize: |
118.25 KB |
| Viewed: |
16896 Time(s) |
|
| Description: |
|
| Filesize: |
96.93 KB |
| Viewed: |
16896 Time(s) |

|
|
|
| Back to top |
|
|
windward1
Joined: 18 Jun 2000
Posts: 1400
|
| Posted: Sat Feb 27, 2016 12:45 pm Post subject: |
|
|
Hi Mike,
Which Model is represented by the plot labeled QuickLook?
Regards,
W1
|
|
| Back to top |
|
|
|
|
You cannot post new topics in this forum
You cannot reply to topics in this forum
You cannot edit your posts in this forum
You cannot delete your posts in this forum
You cannot vote in polls in this forum
You can attach files in this forum
You can download files in this forum
|
|
|

